Mapping College Quizbowl Circuits
In college quizbowl, circuits function somewhat analogously to conferences in college athletics. They are both groups of schools in a (relatively) geographically constrained area that regularly compete against each other. However, unlike conferences, circuits are not rigidly defined by membership in an organization, but loosely defined by tournament attendance. In this post, I map tournament attendance in the college quizbowl dataset and apply a community clustering algorithm to group schools into circuits.
Circuits are an essential facet of the quizbowl community: they’re the unit of regular competition and most people in quizbowl will have 90% or more of their quizbowl interactions with people in their circuit. Building circuit identity and reifying circuit institutions, in a way more in line with athletic conferences, would strengthen college quizbowl measurably.
Mapping tournament attendance
The below map shows the trips schools took to non-national, non-online tournaments in the past six years of the college quizbowl dataset. The thicker and more opaque the line, the more times schools took that trip.
A brief review of clustering
Clustering is a technique for grouping members of a larger group based on common attributes. Common examples include creating segments of a company’s customer base, or determining that pixels in an image constitute a particular object. Crucially, clustering techniques are unsupervised, meaning that they work without a defined target (cf. supervised learning classification models, which use a set of already labeled data to train a model that can sort unlabeled data into groups).
Generally, introductions to clustering begin with methods for clustering tabular data points, with numeric or categorical data. For example, k-means clustering – one of the most popular and widely-taught clustering algorithms – groups clusters based on the means of the variables used to cluster 1. See the example below, where I use k-means to cluster the iris dataset based on petal length and width.
iris_petal_kmeans <- iris %>%
  # kmeans expects a df containing only your predictors and 1 row per observation
  select(Petal.Length, Petal.Width) %>%
  kmeans(3)

iris_petal_plot <- iris %>%
  select(Petal.Length, Petal.Width) %>%
  # convert to factor so ggplot realizes the clusters are categorical
  mutate(cluster = factor(iris_petal_kmeans$cluster))

# Converting this to a df so we can plot the clusters
iris_cluster_centers <- iris_petal_kmeans$centers %>%
  # make sure to preserve cluster info in rownames
  as_tibble(rownames = "cluster")

ggplot() +
  geom_point(data = iris_petal_plot,
             aes(Petal.Length, Petal.Width, color = cluster)) +
  geom_point(data = iris_cluster_centers,
             aes(Petal.Length, Petal.Width, color = cluster),
             size = 6, shape = 21, fill = 'gray50', alpha = .7) +
  theme_bw() +
  theme(panel.border = element_blank())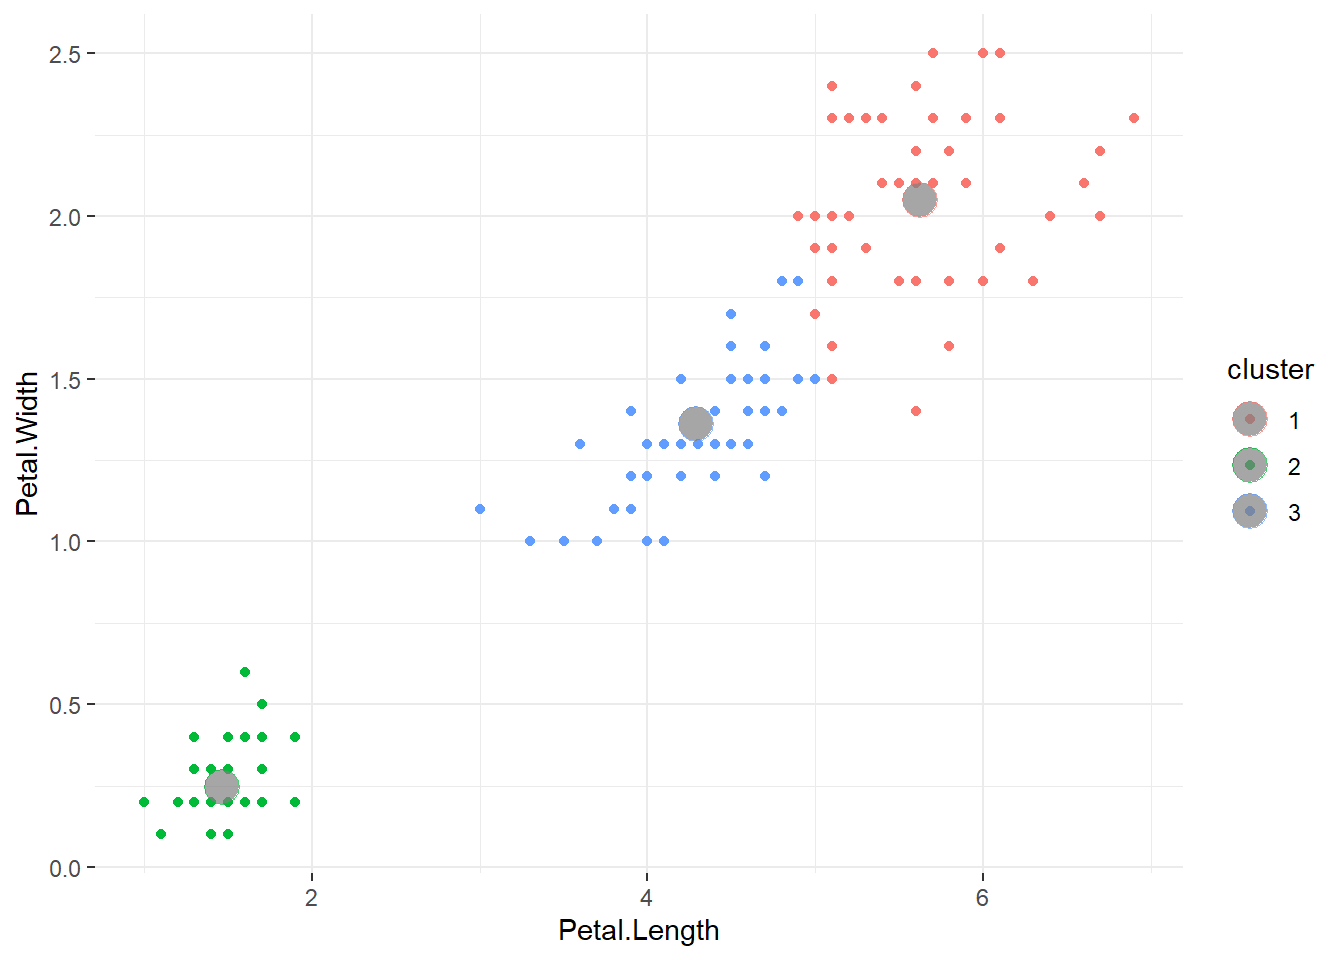
Network clustering
However, in this case, we don’t have neat numeric variables to cluster by, like in iris. Rather, what we have is a network of nodes (schools with quizbowl teams) and edges (trips to tournaments). We’re interested in finding densely packed groups of nodes and edges that are significantly separated from the rest of the graph; in other words, teams that are close and tend to play each other.
Thankfully, this is a problem of interest in studies of networked systems, and there are well-established algorithms we can use. As network studies have taken off over the past couple of decades, the problem of finding communities – these sorts of dense groups of nodes and edges – has become increasingly prominent as well, particularly for networks that represent social relations.
One of the most common algorithms for community detection is the Girvan-Newman algorithm, which works by removing highly-central edges 2, forming communities as edges are removed and subgraphs are split off from the main graph. Eventually, you’re left with a bunch of subgraphs, which each represent a community.
Clustering circuits
The final thing we need to discuss before clustering is weighting edges. Clearly, not all edges are similarly indicative of being in the same circuit: compare Berkeley’s one trip to Maryland (Michael Coates playing solo) to their 30-something trips to Stanford. Should those edges have the same weight?
I assigned edge weights based on a combination of number of trips taken and distance apart 3. I added the distance metric to tease apart circuits that are somewhat loosely linked, but still separate, e.g. teams in the Northeast will occasionally come to the Mid-Atlantic, or likewise with NorCal and SoCal.
This isn’t a perfect map: for one, the Midwest blob mashes together what’s probably three different circuits in actuality (Great Lakes, Midwest, and Great Plains), but I thought it was interesting how close an algorithm got to subjective human definitions.
Circuits by year
Finally, I’ve put together a GIF showing how these circuits have changed year-over-year.
Conclusion
My aim with this post was two-fold: one, to get some experience using network clustering algorithms and introduce them to a non-technical audience; and two, to get people thinking about the importance of quizbowl circuits and what schools constitute “their circuit.” This is but one way to measure a circuit 4, and I’d love to see active players thinking about their circuits and how to nurture and improve them.
What k-means does is it selects $ k $ clusters such that each data point belongs to the cluster whose center is closest.↩︎
To be precise, it iteratively removes the edge with the highest betweenness centrality.↩︎
Specifically, it’s $ N/D $, where N is the number of trips and D is the distance between the schools.↩︎
Others include “which schools have attended a tournament in the past couple of years”, “which teams attend ACF Regionals”, and “which schools have a presence in the regional Discord/organizing chat”.↩︎