An analysis of upsets in quizbowl
Welcome to college quizbowl nationals season! One of the most exciting things about nationals is when a really crazy upset happens and changes the tournament.
Think WUSTL B over Maryland A at 2021 DI ICT, which ended up keeping Maryland A from the top playoff bracket, or Stanford over Ohio State at 2019 ACF Nationals, which ended up keeping OSU from the top superplayoff bracket.
In this post, I’ll cover a number of aspects of quizbowl upsets – how we measure them, their frequency, and how often they happen at each national – using the data from the college quizbowl dataset. Hopefully this is a fun and inspiring (or motivating, depending on which side of the upset you’d be on) post for everyone preparing for nationals!
How to measure an upset?
What is an upset? Coming into 2017 DI ICT, Northwestern was not considered a top-tier contender, yet made it all the way to the final before falling to Michigan A. Was Northwestern’s run through the top bracket due to a string of upsets, or were they just underrated coming into the tournament? Given how much team strength can change tournament-to-tournament due to roster changes or intensive studying, for this analysis I think it makes sense to stick to in-tournament performance as a measure of team strength1. That is, look at how both teams performed in the tournament by a given statistical metric, and count the match as an upset if the team who is worse in the metric won the match.
Then, which metric to use? Ideally you want the metric that most accurately measures team strength, which, in aggregate, means you want a metric that produces a low number of upsets. If a metric is very good at predicting most matches, but fails on a small number of them, it’s a good sign that those matches are upsets of some sort.
The metrics I considered using for this analysis were: points per bonus, bonuses heard per tossups heard (essentially, what percentage of tossups is a team getting), and A-value2. To decide between them, I looked at how accurate they were in predicting the outcome of matches in the dataset, and picked the metric with the highest accuracy.
| Metric | Accuracy |
|---|---|
| Points per bonus | 82.68% |
| Bonuses heard per tossup heard | 83.94% |
| A-value | 86.35% |
As you can see, A-values are more accurate than either points per bonus or bonuses heard per tossup (which makes some sense, as A-value incorporates both).
How frequent are upsets?
Not all upsets are created equal. Take the example of March Madness, where a 10-seed beating a 7-seed will barely register, but a 15-seed beating a 2-seed3 is a historic upset. So we should be asking not only “How frequent are upsets?”, but also “How frequent are upsets when teams have at least an [X] gap in team strength?”
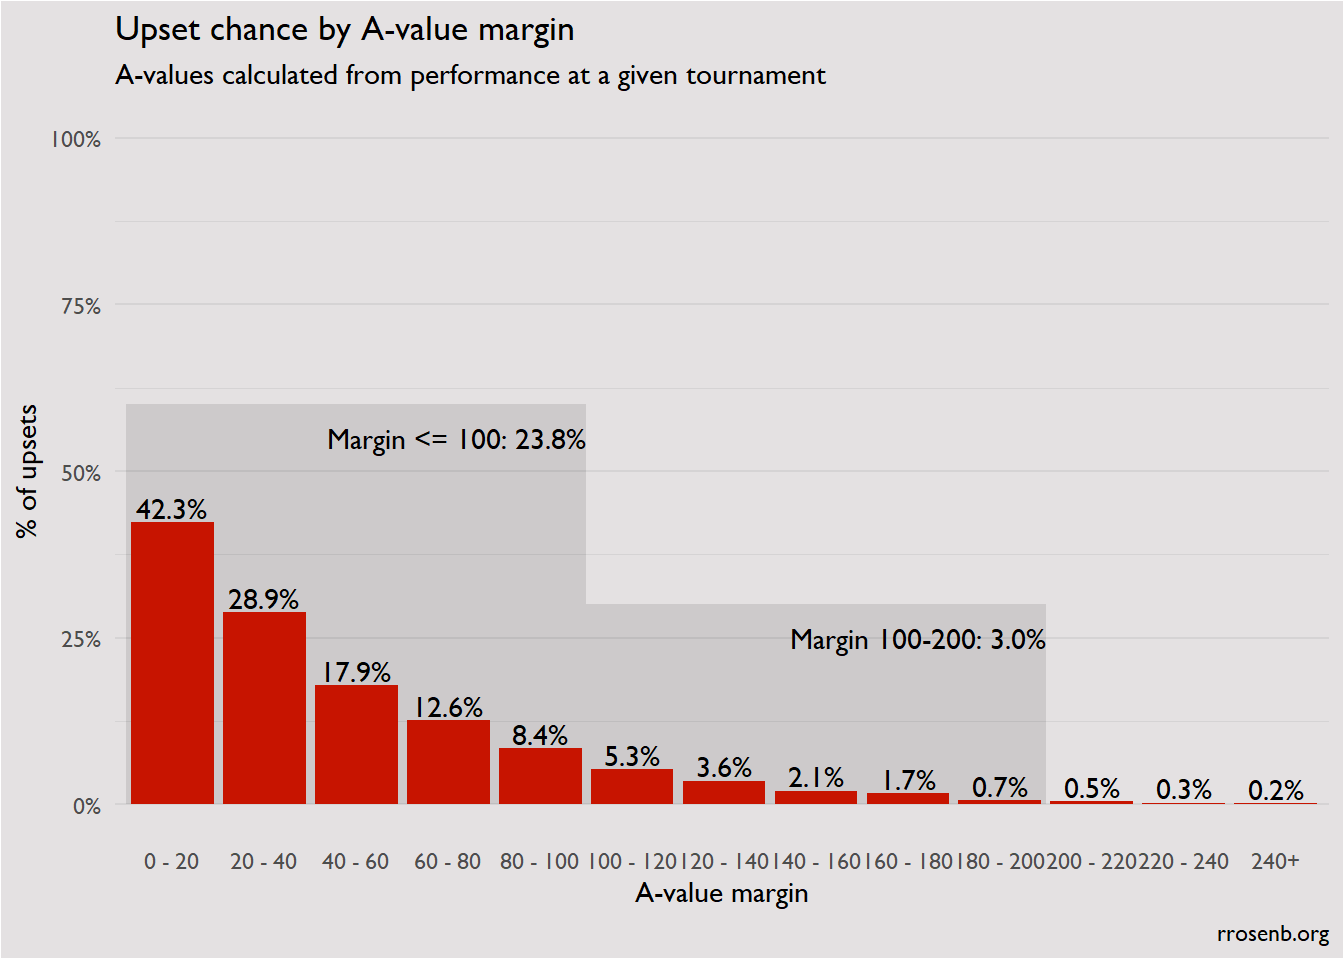
Unsurprisingly, upset chances monotonically decrease with A-value margin4. You can think of A-value margins as equivalent to PPG margins against common opponents. There’s not an exact comparison to PPB margins, since doing that would require assuming the teams are equivalent in tossup skill, which is rarely the case if there’s a PPB gap.
Examples
To illustrate the degrees of upsets we’re discussing, here are some examples of games that were considered upsets at different levels of difference in team strength. The entire game dataset with team A-values, PPB, and tossup stats can be found at this link.
| Year | Set | Winner | Loser | A-value margin | Result |
|---|---|---|---|---|---|
| 0-50 | |||||
| 21-22 | Penn Bowl | Cornell A | Columbia A | 285 - 325 | 260 - 245 |
| 20-21 | ACF Winter | Georgia Tech A | Florida A | 612 - 618 | 365 - 285 |
| 20-21 | ACF Regionals | Oxford D | Cambridge A | 153 - 171 | 200 - 195 |
| 50-100 | |||||
| 21-22 | Penn Bowl | Florida C | Georgia Tech B | 191 - 254 | 225 - 215 |
| 21-22 | ACF Winter | Penn C | Swarthmore A | 145 - 227 | 200 - 190 |
| 20-21 | DII ICT | Maryland B | Chicago C | 257 - 335 | 265 - 200 |
| 100-150 | |||||
| 20-21 | LIT | Georgetown Day A | Maryland A | 351 - 472 | 315 - 295 |
| 20-21 | ICT | York A | Oxford A | 280 - 397 | 375 - 255 |
| 20-21 | ACF Winter | Princeton B | Princeton A | 315 - 433 | 310 - 275 |
| 150-200 | |||||
| 20-21 | SMH 1 | Swarthmore A | Rutgers A | 193 - 367 | 310 - 300 |
| 20-21 | DI ICT | Georgia Tech A | Illinois A | 240 - 391 | 230 - 200 |
| 21-22 | ACF Winter | Case Western B | Kenyon A | 184 - 358 | 260 - 190 |
| 200+ | |||||
| 20-21 | IKEA | Indiana A | Illinois A | 264 - 485 | 265 - 250 |
| 21-22 | ACF Winter | Washington Grey | Georgia Tech A | 158 - 410 | 260 - 240 |
| 20-21 | SMH 1 | Florida C | Vanderbilt A | 271 - 486 | 285 - 275 |
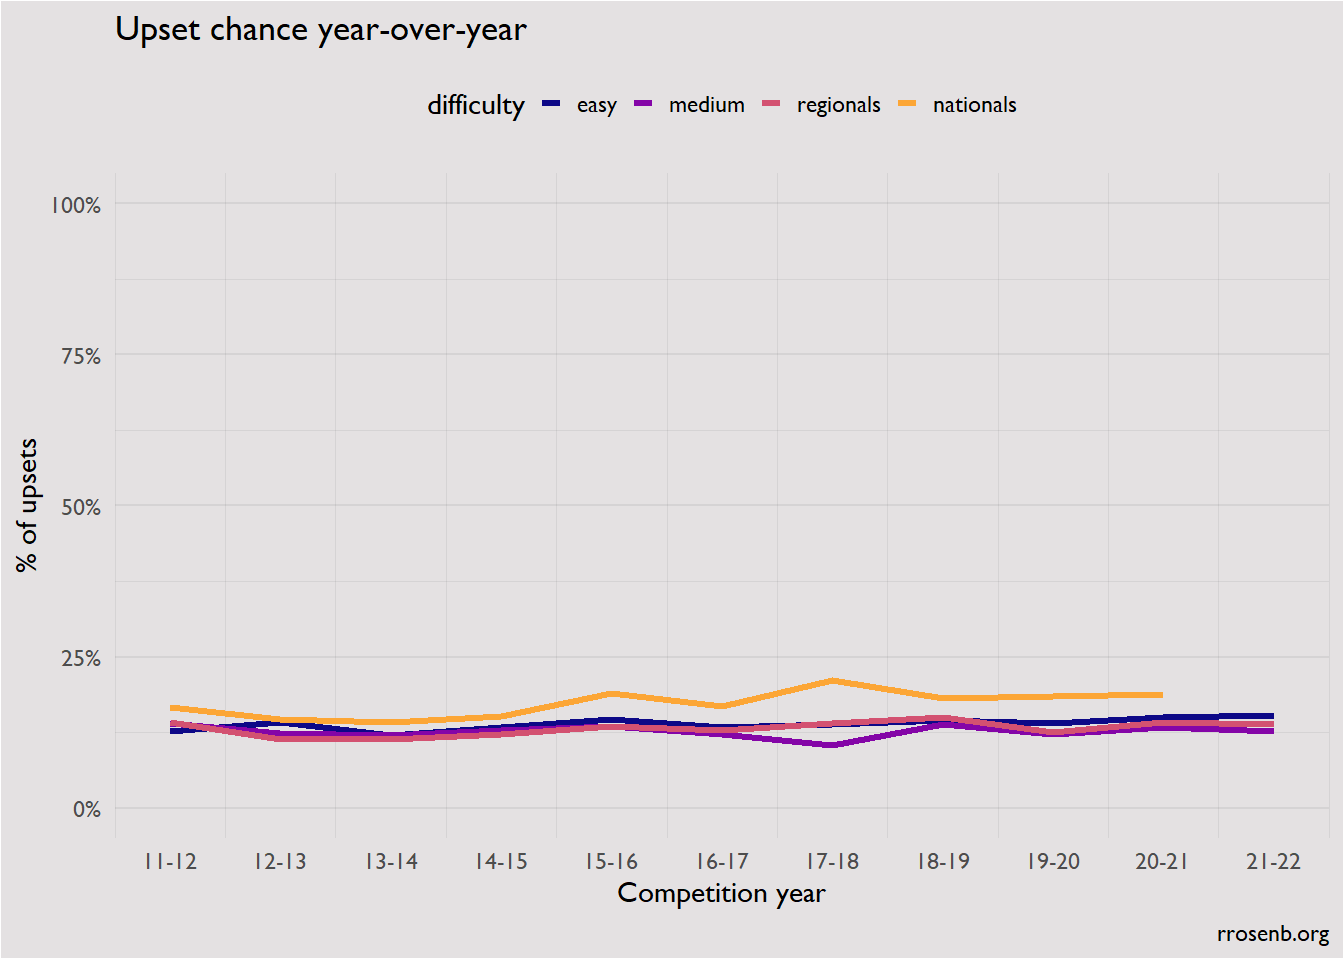
What about difficulty?
One of the claims I was interested in investigating coming into this piece was that harder tournaments have fewer upsets, since the increase in difficulty (and generally longer questions) allows for finer differentiation of skill level. I was skeptical, since questions are written with the potential audience in mind – sure, ACF Fall wouldn’t necessarily differentiate Stanford and Berkeley, but it does differentiate novice teams – and so looking at upsets measures only how appropriate sets are for their field, not some hypothetical other field.
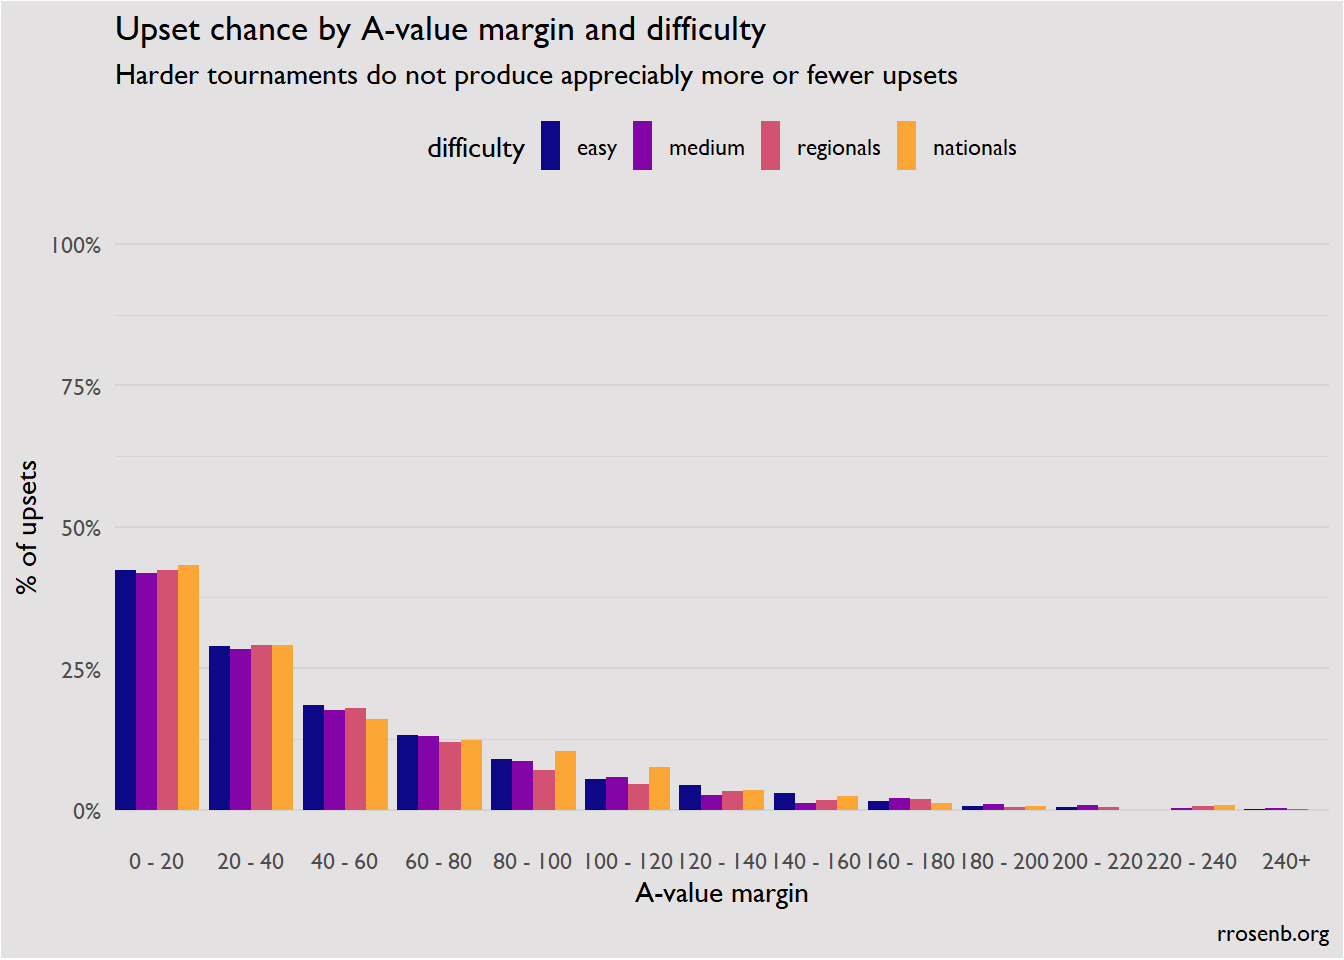 Somewhat surprisingly, upset rates are very similar across all difficulty levels.
DI ICT vs. ACF Nationals
It’s long been common wisdom among involved college quizbowlers that DI ICT is more prone to upsets than ACF Nationals: shorter questions, a game clock, and a distribution heavy on geography and pop culture are the most proferred explanations. But is it actually true that ICT is more prone to upsets?
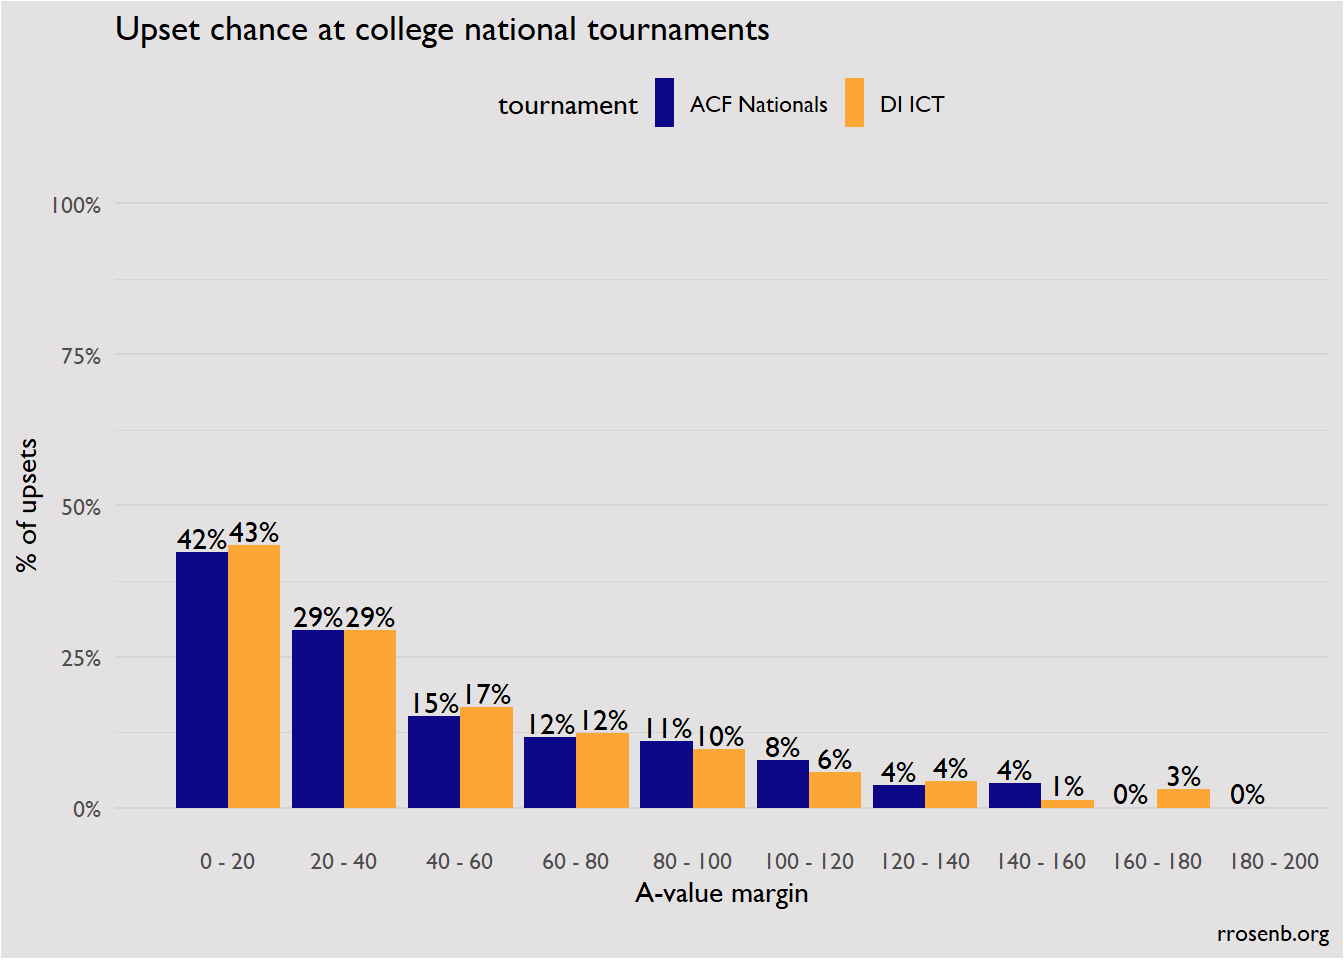
Instead, I’d offer that DI ICT does actually test skill with a similar level of effectiveness to ACF Nationals, it’s just a different set of skills. When people think of how strong a particular team is, they tend to focus on the team’s ability on an ACF distribution. That undervalues teams with strong NAQT players and can cause some matches to seem like upsets when in fact the team that won was just better at the NAQT distribution/format.
Conclusion
In the course of my analysis, I was not able to find a broad pattern in the occurrence of upsets, whether by the dimensions examined above, or year-over-year (below). This is a remarkably consistent result. I’d be interested in ideas about other ways to look for patterns in upsets or ideas about how to transform the data, but as of now the rate of occurrence of upsets seems to be a very fundamental and stable part of college quizbowl.
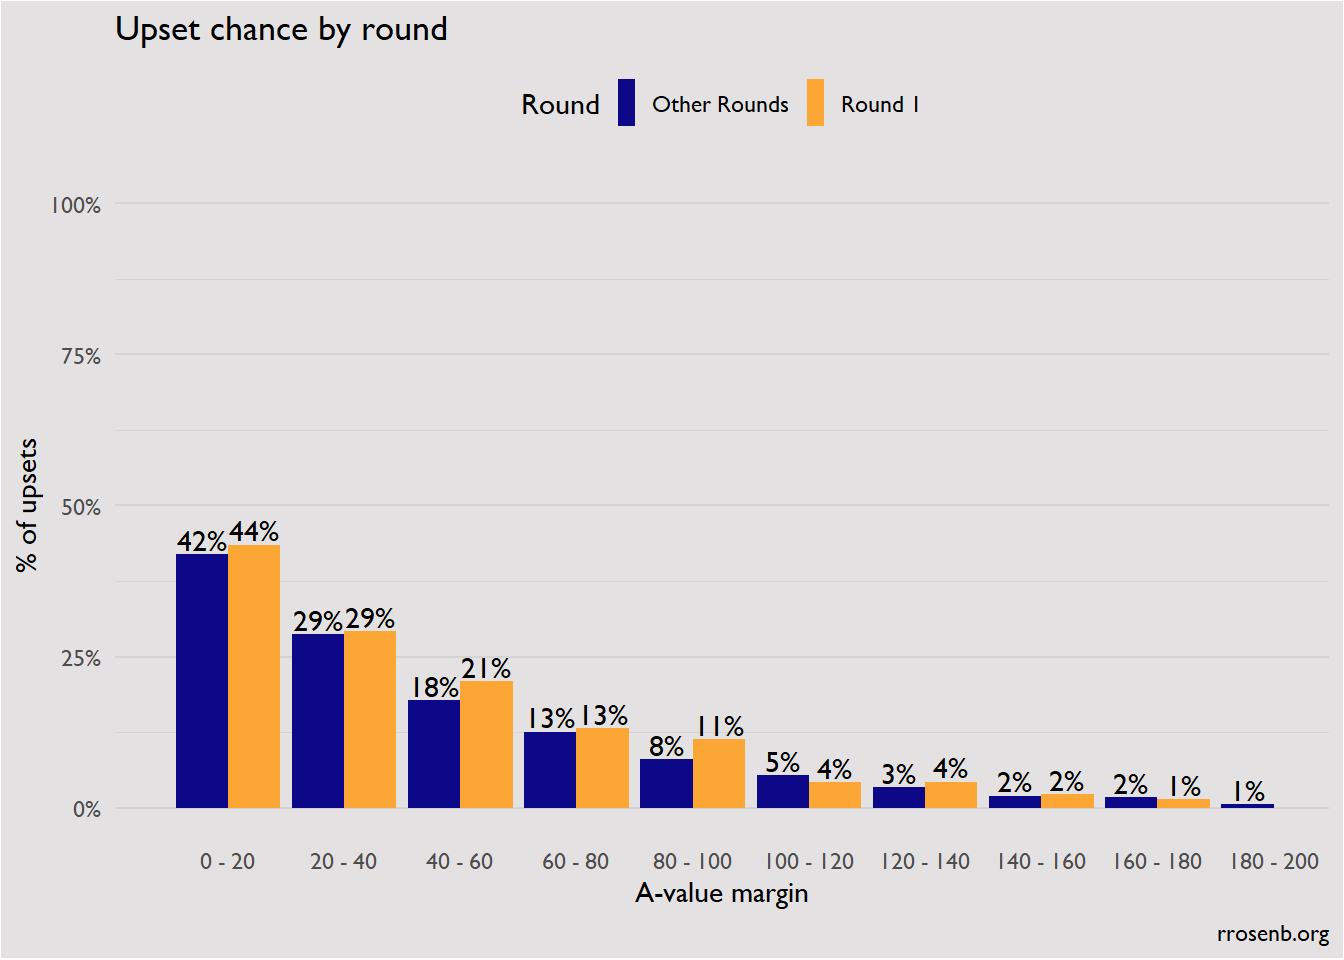
Addendum: Upsets by round
By request of Mike Cheyne, I also looked at whether upsets are more common in Round 1 of a tournament (very slightly!).
I do think some sort of continuous measure of team strength, like Elo, would be interesting to calculate, but that’s for another post.↩︎
You can think of A-value as essentially points per game, adjusted for opponent strength.↩︎
And then a 7-seed and a 3-seed.↩︎
They also decrease pretty regularly too: no equivalent to the 5 vs. 12 matchup in men’s March Madness.↩︎